Overview
This article explains how to correctly troubleshoot issues relating to the PeerApp System Status showing as "Disabled".
While in this status, caching functionality is unavailable as the system is not processing traffic.
Symptoms may include:
-
PeerApp dashboard showing System Status as "Disabled" and highlighted in RED.
-
System Events log on the dashboard shows the following events:
"cluster has been degraded"
"cluster has been disabled"
"no volumes are available"
- File system mount points used by PeerApp are full i.e.
df -hshows partitions with 100% utilization. - No traffic showing in the Statistics > Bandwidth graphs
- "Status > Hardware View" on the UI shows no data connectivity through the ethernet interfaces to the router.
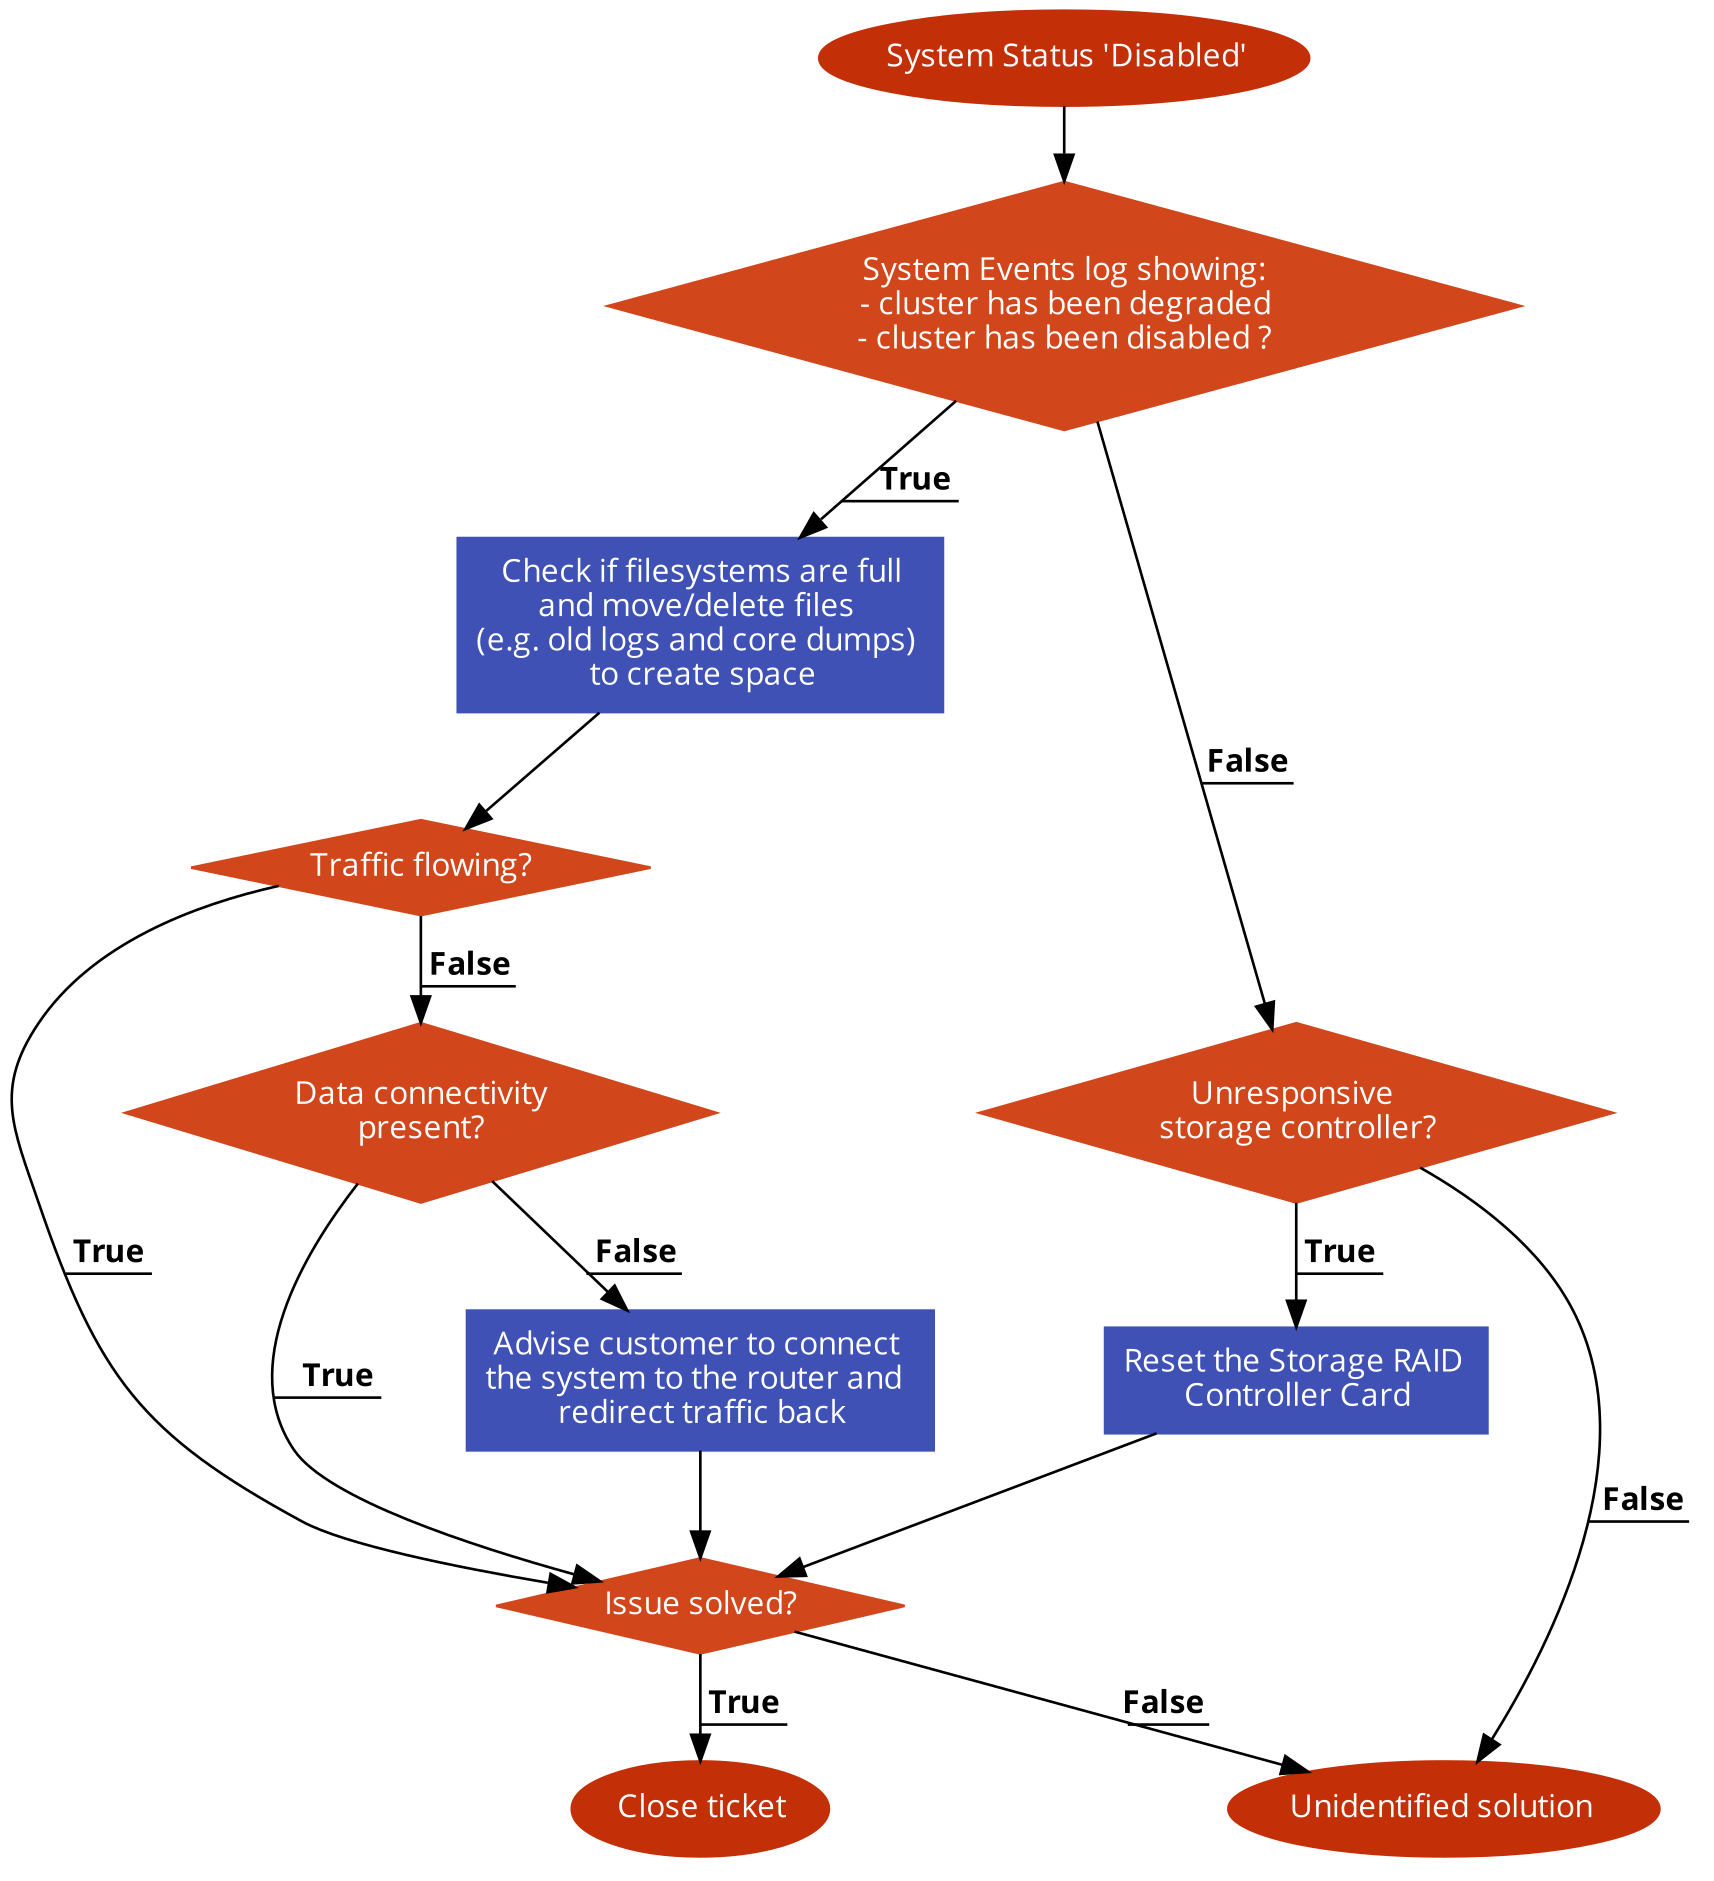
Workflow
Click on the embedded flowchart image to enlarge.
Instructions
Checking if filesystems are full
Check the file system for space utilization, looking out for any file systems that are at 100% utilization.
This can be done using the df -h command which has the following example output:
root@11.x.y.z /home/padmin # df -h
Filesystem      Size  Used Avail Use% Mounted on
/dev/sda2        43G  4.3G   36G  11% /
devtmpfs         63G     0   63G   0% /dev
tmpfs            63G  4.0K   63G   1% /dev/shm
tmpfs            63G  9.8M   63G   1% /run
tmpfs            63G     0   63G   0% /sys/fs/cgroup
/dev/sda1       477M  142M  306M  32% /boot
/dev/sda5      1021G   81G  888G   9% /opt
/dev/sda3        37G   36G     0 100% /var
tmpfs            13G     0   13G   0% /run/user/1000
In the above example, the /var partition is at 100% utilization whereas /opt has 888GB free hence the space issue can be addressed by moving files to create space. A typical culprit for space overutilization is core dumping files which can safely be deleted or moved to a different partition to create space.
<supportagent>
See PeerApp: Freeing up space when disk partition is full for more information.
</supportagent>
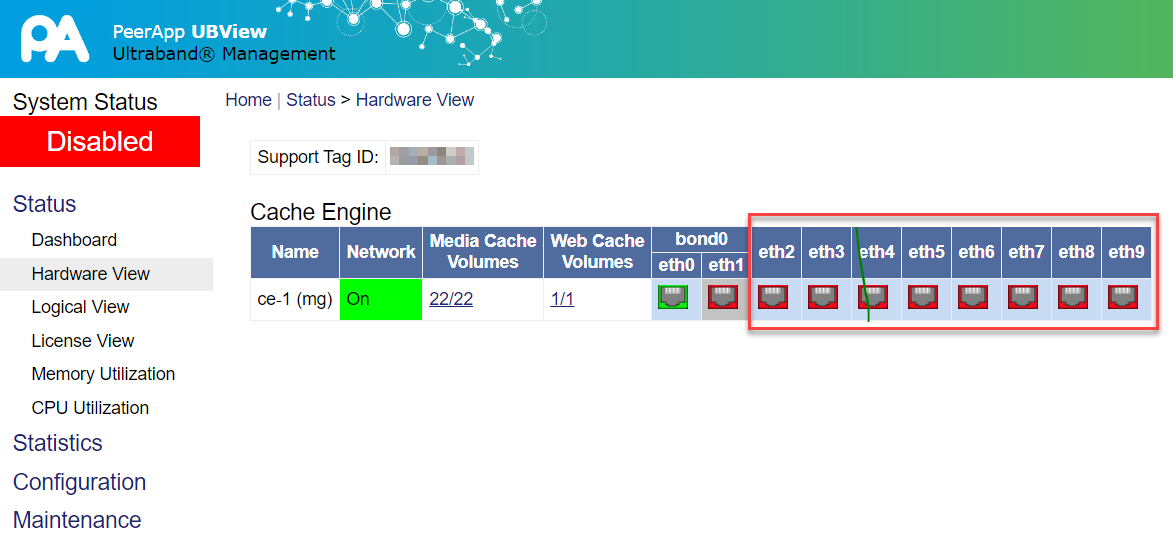
Checking if Data connectivity is present
When the Hardware View shows no data connectivity through the ethernet interfaces to the router, the customer should ensure PeerApp is connected to the router to redirect traffic through the caching engine. PeerApp System Status will usually change to "Disabled" when there is no data connectivity.
This can be verified from the UI by navigating to Status > Hardware View and checking the status of the ethernet interface to the router.
The example below shows no data connectivity:
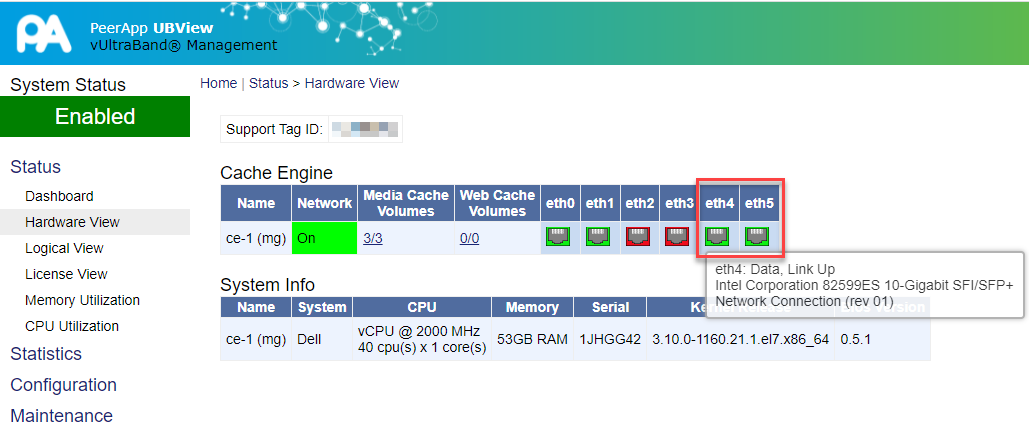
Example showing data connectivity to the router through eth4 interface having the "Link Up" status:
Checking for an unresponsive Storage controller
Check for an unresponsive storage controller as follows:
-
Execute the
show volumesconsole command which should show all volumes having the 'inactive' state as shown here:
-
Execute the
iscsiadm -m sessionLinux command and confirm that there were no active iSCSI sessions:
-
pingthe storage enclosure IP and confirm that the host is unreachable.


The above symptoms confirm the problem root cause as an unresponsive storage controller that is resolved by Resetting the Storage RAID Controller Card as documented in PeerApp Server showing System Status as Disabled.
Priyanka Bhotika
Comments